The idea of the data browser started in 80's by Dr. Rudolf B. Husar. When you have a multi-dimensional dataset, the point is to create a view for each dimension, and to use the same surface for both input and output. The original program, written for MS Windows 2, was mentioned in Ben Scheidermans book Designing the User Interface page 191.
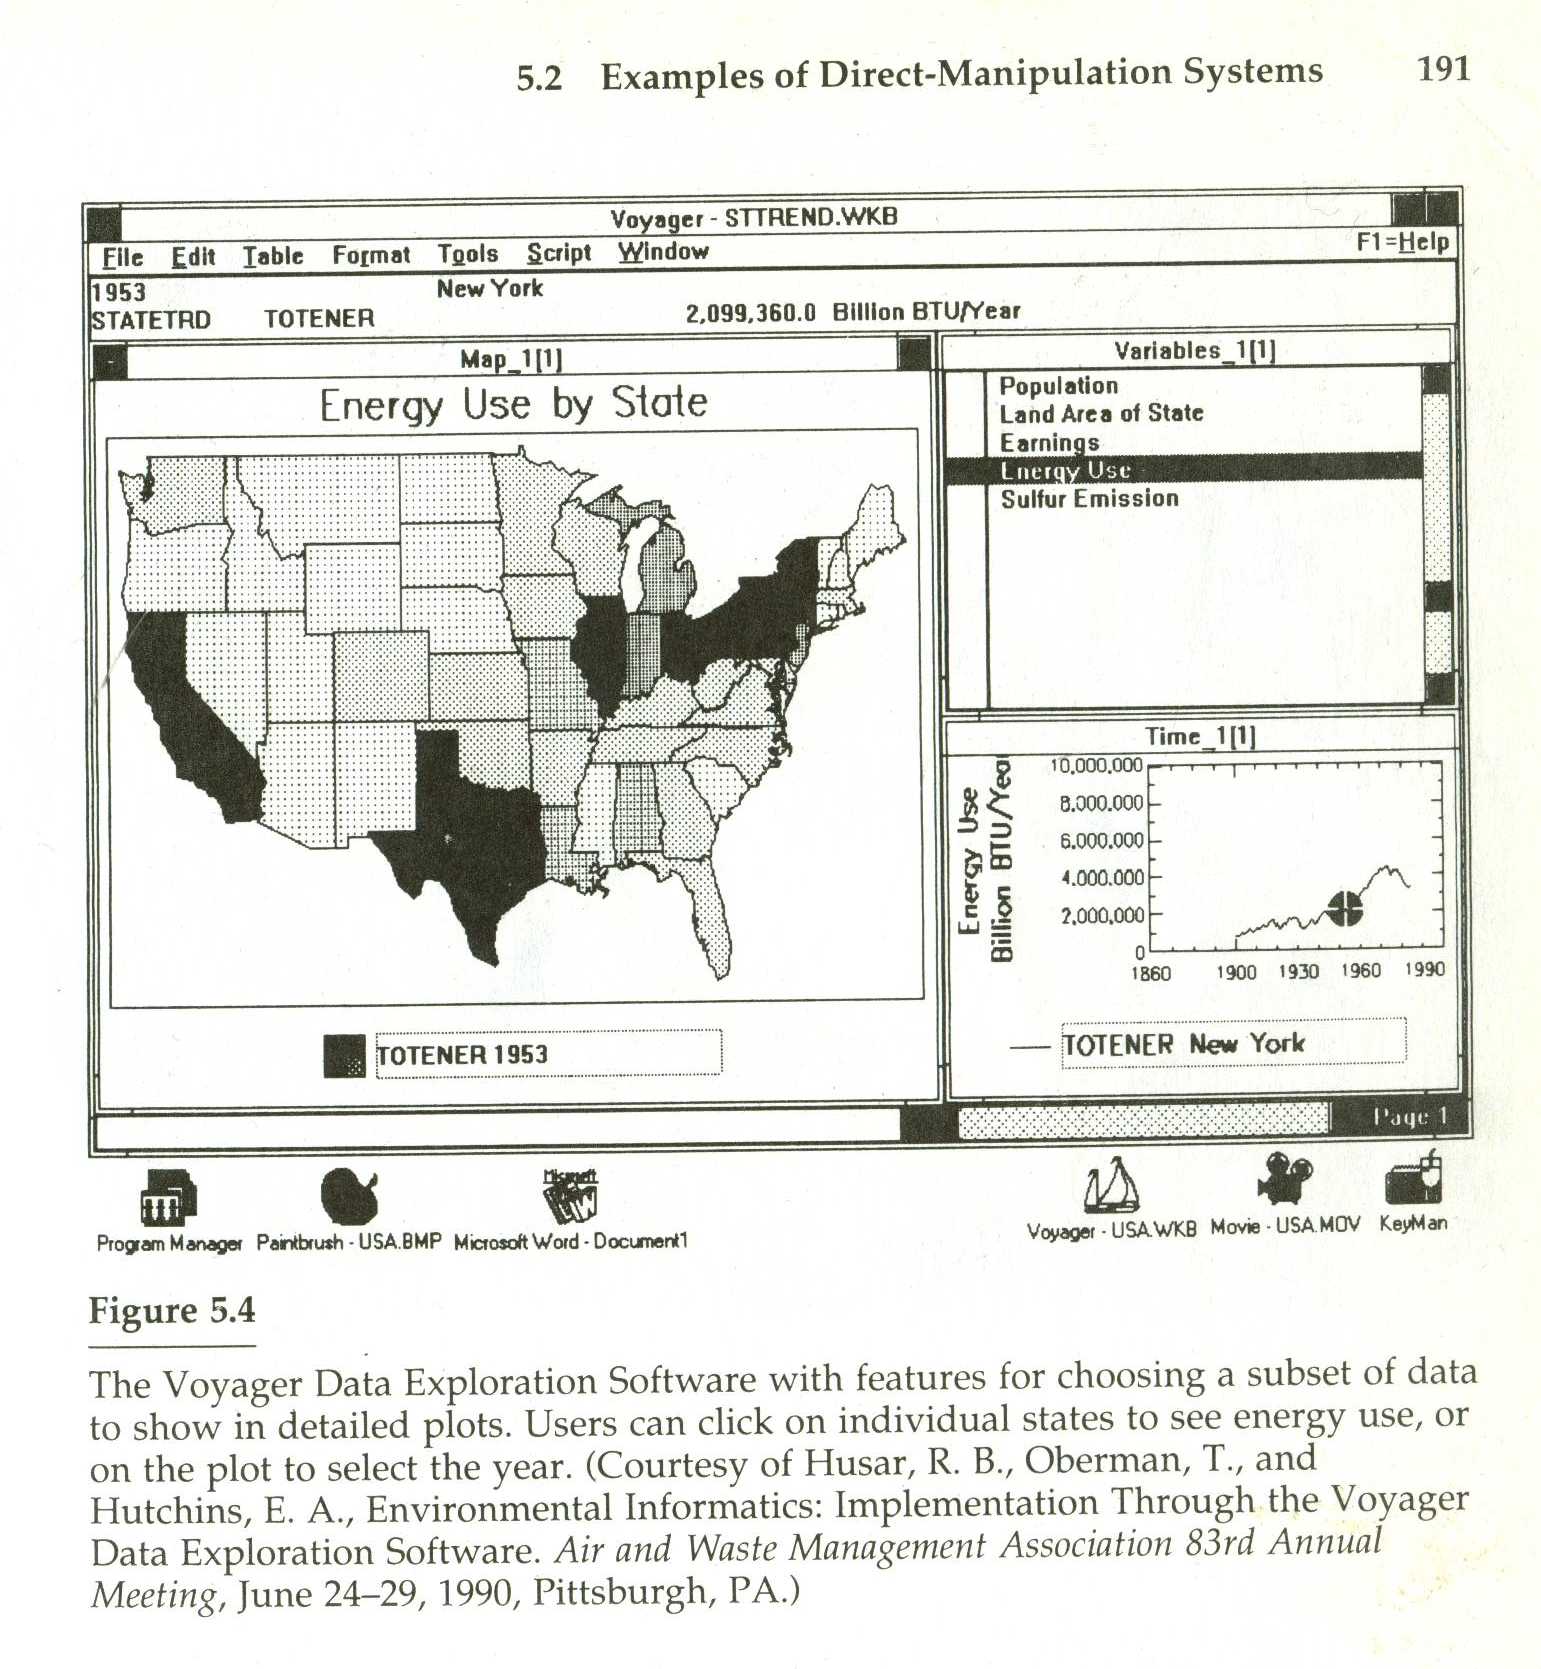
On a geographical map, you see geographical content. But you can also select a location. On a time series view, you see the data on that location as the time goes on, but you can also select the time you want to see on the map.
I got involved with the project in 1992, as a Computer specialist for CAPITA, but left in 1995 for six years. By year 2000 it was obvious, that the correct environment to do this was the web. Fall 2001 I slapped together a demo version in a month. It was a typical proto: no concern to separate concerns, just get the map and time view working with a single dataset and a few satellite image downloads for a background map.
Such monolithic applications do what you want them to as long as it is built into the system. The problem is that it's difficult to do anything that wasn't planned by the system designers. That's why we chose Service-Oriented Architecture as the foundation: There is no monolithic application; the data is delivered by services, processed by services and rendered by services. So the datafed browser is basically a Unix pipeline - just a data flow system.
Datafed collects data from multiple external sources. View the
Data Catalog and the dataset VIEWS in the
Data Browser. You can click on the map or time view to choose different location or date.
Views are also automatically combined web services; you can change the datetime in the
url and choose a different date for data, in this case SO2 fine, under 2.5 micrometers size:
example of a map view as a service.
These can then be combined to create applications. Here is a real time console (lot's of data, slow startup). It's just a collection of map views of different pages, compiled into a KML file for Google Earth. You can view the KML file in Google Earth, but it is not the only program to view KML files. Our console reads a KML file, and displays the map layers side by side, and animates each map in unison. This animator uses a full image, so please don't try to animate a month. At some level your browser will run out of memory.
Probably the best idea I had during these years was the use of NetCDF CF-convention to create a WCS: Web Coverage Service without configuration. NetCDF itself has no information what the data is about. A NetCDF convention is kind of like XML Schema. Some variables are marked as dimensional, some are data. If you have data in NetCDF CF format, you can just serve it as a WCS.
The OWS system is used in a couple of places now. Juelich in Germany grabbed my code, and their programmer, Michael Decker, added very substantial parts to the system and started to use it for internal purposes. Recent list of their simulation model services here. Northrop-Grumman just installed it and uses it to serve data.